
Importance of Data Visualization
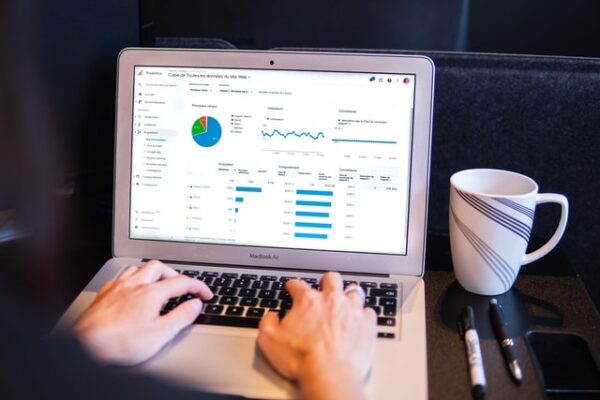
Data visualization is the practice of taking numeric or other raw data and transforming it into something visually appealing and easy to understand to a wider audience. Some examples of visuals include pie charts, bar graphs, heat maps, and word clouds. As more data about people and their activities become available online, data visualization grows in usefulness. Data analysts and others are also seeing more and more opportunities to create these visuals. Here are a few reasons why data visualization is important.
It Tells a Story Quickly
As someone who has driven investments in data management and visualization products, Scott Sandell knows the importance of data in helping people in all fields of employment make decisions. Whether you work in finance, education, healthcare, or another field, it is crucial to be able to present the data that you gather in a way that is quickly and easily understood. Often, analysts in these lines of work have to sift through large amounts of data and show the most critical pieces to the managers and CEOs of their company. People in those positions are usually very busy and need to see the meaningful parts of the data quickly. Doing so is possible with charts, graphs, and maps, particularly interactive ones, meaning that the user can pick and choose which pieces of data they see. For example, if there is a map displaying the average credit card debt of adults by U.S. state, and someone is interested in the average debt of women only, then an interactive map would allow the user to filter and display data only pertaining to women.
It Helps Drive Decisions
Raw data can look very messy, be difficult to understand, and often requires a lot of cleanups. It is not easy to draw conclusions simply by looking at a raw dataset. However, visuals such as bar and line graphs are great for showing various patterns and relationships over a period of days, months, years, or whichever increment of time best suits your data. Visuals containing two or more data points allow viewers to see other factors that influence things like sales and customer satisfaction. Being able to see these trends and relationships helps managers make the most profitable decisions for their company.
It Helps Defend Decisions
People do not always make the correct business decisions, even when using data, since data and trendlines are not perfect. An unfortunate business decision can lead to disappointment and worry within a company and among shareholders. However, having data visualizations that tell a story and pinpoint trends are very important in helping to defend a decision. For example, if a decision to update a company website less often leads to a larger than expected decline in online sales, having a trend line showing that this had a low likelihood of happening may make people better understand your decision. Once the decision is understood, the company can move on to assessing and improving the situation.
Data visualization is growing in importance, and it is easy to see why.