
Crypto Heatmaps: Your Visual Compass in the Dynamic World of Cryptocurrency
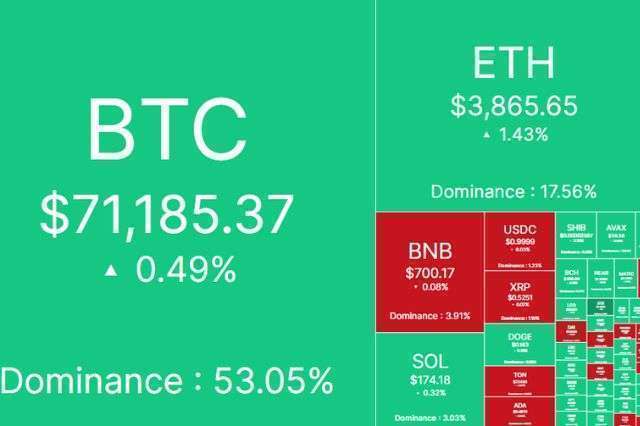
Market Cap. Dominance Heatmap
Cryptocurrencies have ushered extreme volatility into global finance captivating traders with high-stakes risks and rewards. Their mercurial price movements can humble even seasoned investors regularly. Decoding insights from apparent chaos is vital. This is where crypto heatmaps enter – visually simplifying complex datasets through colored matrices tracking sector momentum daily empowering informed decisions.
What is a Crypto Heatmap?
A crypto heatmap refers to a graphical data visualization technique that uses color coding arranged in tabular layouts enabling effortless pattern perception across chosen performance indicators over defined timeframes for various cryptocurrencies. This allows for magnifying wider momentum shifts or outlier divergences.
By converting metrics into shades of color, heatmaps tap into innate human visual processing capable of decoding complex matrices faster than combing endless tables. Intense colors draw user attention towards disproportionate price spikes or crash warnings for instance demanding analysis. Clustered colors indicate coordinated movements demarking broader market trajectories rather than isolated events related to individual coins warranting portfolio strategy changes.
The Colors of Change
Heatmaps use the universal color semantics of red and green to denote negative and positive changes mapped onto a chromatic spectrum indicating the degree shifted apart from the baseline median. This simplified scheme enables instant gauging of performance.
- Green: Shades of green reflect upward movement across chosen indicators like spiking prices, volumes, and market cap relative to yesterday’s baselines signifying growing demand from traders noticing wider confidence. Darker greens signal higher buying urgency capped by miniature vertical price walls along uptrends.
- Red: Varying red warns about plunging metrics across timeframes implying negative momentum caused by domino selling sentiments due to either inner token issues or sector-wide corrections weighing universally devaluing portfolios as indicated by clustering reds. Predicting deeper supports prevents panic selling.
- Color Intensity: The intensity of colors indicates the relative magnitude of indicator change between measurement intervals. For daily heatmaps, deeper colors reflect higher intraday jumps compared to minor shades implying more moderate gains visually allowing estimation of volatility ranges at a portfolio level.
Benefits of Using a Crypto Heatmap
Crypto heatmaps offer a multitude of benefits for both novice and experienced traders:
- Quick Identification of Trends: Instead of monitoring charts individually, top-performing and faster-moving cryptos instantly stand out allowing focus towards researching catalysts behind emerging high-flyers primed for upsides.
- Visual Representation: Condense complex data into intuitive color codes registered simply at a glance speeding pattern perception and trend handicapping complemented by other analyses.
- Comparative Analysis: Contrast price differentials and volatility across similar crypto cohorts like DeFi platforms, meme tokens, or Layer 1 protocols identifying outperformers and laggards guiding allocation optimization.
- Market Sentiment: Heat visuals help gauge emotional undercurrents across timeframes – whether euphoric or fearful – defined by color spreads pointing to peak bubbles or capitulation moments assisting decision.
- Risk Management: Easily highlight abnormally volatile assets requiring position sizing adjustments to limit portfolio drawdowns during corrections while culling consistently underperforming cryptos dragging returns.
- Portfolio Management: Birds-eye heatmap mosaics track balanced portfolios spanning varied sectors like oracles, DAOs, and cryptocurrencies for mitigating concentration risks from uneven exposures to single domains.
- Research Tool: Identify research-worthy crypto assets undergoing announced developments like protocol upgrades, merger news, or layer 2 scalability integrations that separate hype from fundamentals worth monitoring.
Types of Crypto Heatmaps
There are several types of crypto heatmaps, each catering to different needs and preferences:
- Price Change Heatmaps: The most popular variant tracks price movements over chosen intervals whether hourly, daily, or weekly gauging momentum range bound between peak greens to excessive reds.
- Volume Heatmaps: Trades volume changes reveal genuine activity behind headline grabbers weeding out illusory ghost trends lacking buyer conviction helpful for uncovering real adoption leaders.
- Market Cap Heatmaps: Combined valuation changes filter low-value cryptos tracking impactful market capitalization shifts committed by institutional and whales visible through the deepest color intensity.
- Combined Heatmaps: Merged datasets blend price-volume metrics in a unified heat column for each crypto asset creating stacked visual effects compounding intensity for strongest performing tokens demanded simultaneously on multiple counts.
- Sector-Specific Heatmaps: Custom reference market filters spotlight sector subsets like metaverse cryptos, energy blockchain tokens, or decentralized finance protocols isolating industry leaders versus laggards indicating domain-specific capital inflows.
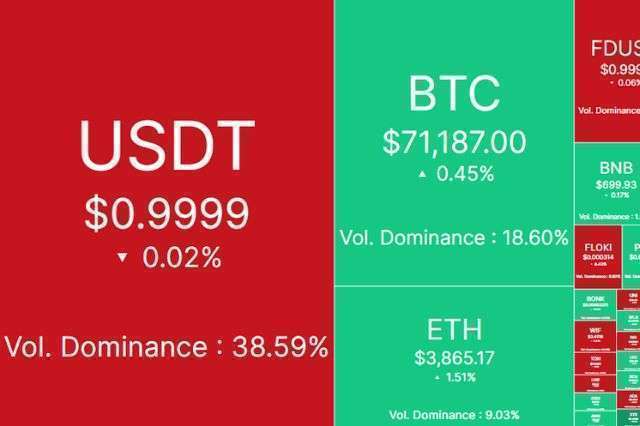
24hrs Volume Dominance Heatmap
How to Interpret a Crypto Heatmap
Interpreting a crypto heatmap involves analyzing the colors, patterns, and trends presented in the visual representation. Here are some key aspects to consider:
- Color Intensity: Intensity denotes the relative magnitude between measurement periods on chosen metrics with deeper colors equals higher value creation.
- Color Distribution: Widespread intensities signify broad rallies while concentrated shades indicate isolated breakouts warranting validity checks.
- Patterns and Clusters: Groupings suggest fundamental or technical correlations helping uncover industry-specific catalysts versus random successes allowing better informed projections.
- Timeframe: Longer interval heatmaps smooth short-lived spikes enabling durable trend identification and macro market cycle tracking guiding strategy.
- Volume: Higher volumes boost validation likelihood of emergent trends implying stronger conviction rather than misleading pumps and false breakouts.
- Market Cap: Growing valuations must accompany vertical gains as sustainable confirmation that added stakeholder wealth permeates across wider ownership versus concentrated gains.
- Comparison: Contrast rally dynamics across comparable classes and categories for learning translatable insights regarding investor appetite shifts, saturation signals, and consolidation timing relevant for future plays.
Tips for Using a Crypto Heatmap
Here are some tips for maximizing the benefits of a crypto heatmap:
- Choose the Right Heatmap: Align heatmap type and variables tracked to your core analysis needs spanning monitoring overall markets, sector tracking, discovery, or individual asset diagnostics to extract applicable findings.
- Customize the Heatmap: Tailor Saul filters for market cap ranges, volume floors, price movements, and availability across target exchanges or wallets to streamline insights towards actionability eliminating superfluous data.
- Use Heatmaps in Conjunction with Other Tools: Validate heatmap observable patterns with granular chart inspection, community forums, and on-chain analytics for improved reliability before acting combining macro and micro insights.
- Don’t Rely Solely on Heatmaps: Heatmap-driven analysis works best as supplemental input moderating absolute interpretations. Factor portfolio goals, risk appetite, and diligent coin fundamentals assessment for a balanced perspective.
- Be Aware of Limitations: Lagging data, sentiment skews, valuation discrepancies between exchanges, and isolated price manipulation can distort color composites somewhat limiting standalone reliability requiring prudent sense checks.
Heatmaps in Action: Real-World Examples
Scenario 1: Identifying Trends
Favorable regulatory shifts towards blockchain adoption in Southeast Asia filter regional crypto leaders experiencing bullish price action and heavy volumes as indicated by intense green clusters. These identify investment-worthy zones.
Scenario 2: Spotting Volatility
Sudden red spikes warn of heavy intra-day selling as reactive investors pull out from tokens of vulnerable platforms hit by cyber-attacks resulting in flash crashes plunging valuations.
Scenario 3: Comparing Performance
Positional changes between historical top 10 crypto assets and recently rising contenders reveal maturing markets consolidating towards fundamentally weighted allocations unlike previous hype-driven rankings reflecting investor sophistication.
Scenario 4: Finding Opportunities
Sector-specific heatmaps contrast rallies across dying themes like Metaverse against rising Web 3.0 domains pointing to congestion and money migrations diagnosing possibilities for rebalancing portfolios ahead of mass movements.
Conclusion
As crypto adoption advances, simplifying information complexity using visual analytics like heatmaps offers crystal clarity to all user levels occupied within crowded matrixes of endless data streams. Their color-coded output reduces cognition strain through pattern perception unlocking opportunities otherwise lost in number overwhelm. Treat heatmaps as your first compass guiding wisdom, not the final one, pointing towards moves deserving deeper diligence before commitments.